
[cricket_score_projector]
If you’ve ever watched a cricket match and wondered “What score will this team finish with?”, you’re not alone. Cricket fans, commentators, fantasy players, and analysts constantly estimate a team’s final score while an innings is still in progress. That’s exactly what our Projected Score Calculator is designed to do.
Whether you’re following an IPL thriller, an ODI World Cup match, a T20 international, or even a Test match, this calculator predicts the expected final score based on the team’s current runs, overs completed, wickets lost, match format, pitch conditions, and other important match factors.
Unlike a basic run rate calculator, our Projected Score Calculator goes a step further by considering modern cricket variables such as:
- Live match data
- Current run rate
- Wickets remaining
- Pitch conditions
- Dew factor
- Match format
- Ground size
- First innings projections
- Second innings chase predictions
Simply enter the current match situation—or choose a live match—and our calculator instantly estimates the likely final total.
Whether you’re a casual cricket fan or a fantasy cricket expert, this tool helps you understand how a match is likely to unfold.
Table of Contents
What Is a Projected Score in Cricket?
A Projected Score is an estimate of the total number of runs a batting team is expected to score by the end of its innings if it continues scoring at approximately its current pace while considering factors like wickets remaining and match conditions.
In simple terms:
Projected Score = Expected Final Total Based on Current Match Situation
For example:
- Current Score: 92/2
- Overs Completed: 10
- Match: T20
The current run rate is:
92 ÷ 10 = 9.2 runs per over
If the team continues scoring at this pace for the remaining 10 overs:
9.2 × 20 = 184 runs
So, the projected score becomes 184 runs.
However, modern cricket is far more dynamic than simple mathematics. Teams often accelerate during the final overs, lose wickets, or slow down on difficult pitches. That’s why advanced projected score calculators—like the one on Cricket Stance—consider additional factors instead of relying solely on the current run rate.
Why Is Projected Score Important?
Projected scores are one of the most frequently discussed statistics during live cricket matches. Television broadcasters display them almost every over because they provide viewers with a realistic expectation of where the innings is heading.
Projected scores help:
Cricket Fans
Fans can quickly judge whether a team is building a competitive total or falling behind the expected scoring rate.
Fantasy Cricket Players
Fantasy users can predict:
- Which batters may accelerate
- Which bowlers are likely to bowl at the death
- Expected batting points
- Boundary opportunities
- Strike rate bonuses
Commentators
Commentators constantly compare:
- Current score
- Required run rate
- Projected total
- Historical winning scores
This gives viewers context throughout the innings.
Coaches and Analysts
Modern teams continuously monitor projected totals to adjust strategies.
Examples include:
- Promoting aggressive batters
- Holding wickets for the death overs
- Slowing the innings to avoid collapses
- Targeting weaker bowlers

How Does Our Projected Score Calculator Work?
Our calculator uses two different prediction methods depending on how you choose to use it.
1. Live Match Prediction
Simply choose an ongoing match from the Live Matches tab.
The calculator automatically reads available live score information and predicts the final outcome.
It analyses:
- Current score
- Overs completed
- Wickets lost
- Match format
- Live innings status
- Pitch conditions
- Dew conditions
Instead of making a simple mathematical projection, it applies cricket-specific adjustments to estimate a more realistic total.
2. Manual Score Prediction
If your match isn’t listed, you can manually enter:
- Batting Team
- Bowling Team
- Current Runs
- Wickets Lost
- Overs Completed
- Match Format (T20 or ODI)
- Pitch Type
- Ground Size
- Dew Conditions
The calculator then predicts the likely final score using the same advanced logic.
This makes it useful for:
- Club cricket
- School tournaments
- Local leagues
- Fantasy contests
- Match simulations
- Practice analysis
How Is Projected Score Calculated?
At its core, every projected score calculation begins with the Current Run Rate (CRR).
Step 1: Calculate Current Run Rate
Current Run Rate = Current Runs ÷ Overs Completed
Example:
Runs = 118
Overs = 13
Current Run Rate =
118 ÷ 13 = 9.08
Step 2: Multiply by Total Overs
For a T20 match:
Projected Score
= 9.08 × 20
= 182 runs
While this provides a quick estimate, it assumes that the batting team will continue scoring at exactly the same rate throughout the innings.
In reality, that rarely happens.
Teams often accelerate in the final overs, lose momentum after wickets, or change strategy depending on the match situation.
That’s why advanced prediction models apply additional adjustments.
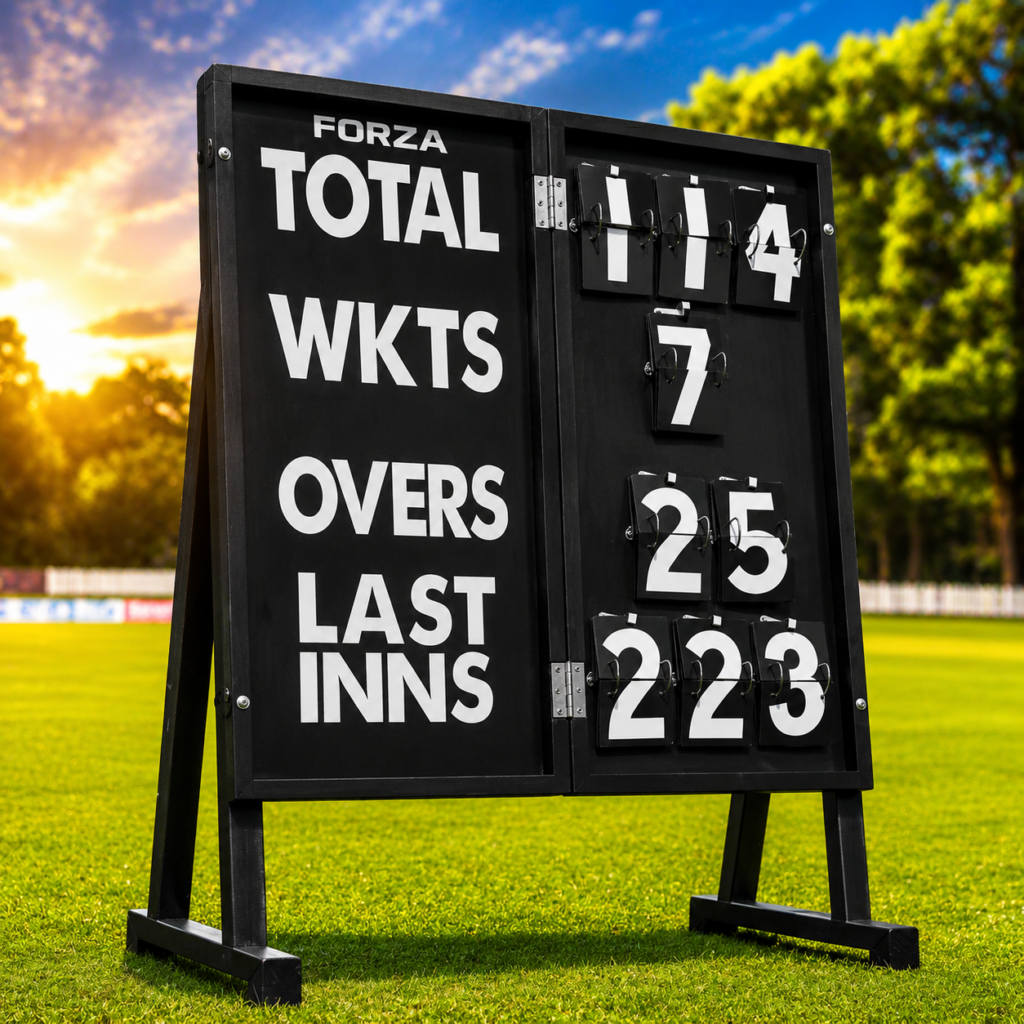
Factors That Influence a Projected Score
Professional analysts know that cricket is influenced by much more than just the run rate.
Our calculator incorporates several important variables to produce more realistic predictions.
1. Current Run Rate
The current run rate forms the foundation of every projection.
A team scoring at:
- 10 runs per over
- with 10 overs remaining
is expected to finish around 200 runs, assuming no major changes.
However, this estimate is refined by other match conditions.
2. Wickets Remaining
Wickets are one of the biggest indicators of future scoring potential.
For example:
150/2 after 15 overs
The batting side still has eight wickets in hand.
This allows aggressive batting during the final five overs.
Projected score:
210–225
Now compare that with:
150/8 after 15 overs
The batting team is likely to play cautiously to avoid being bowled out.
Projected score:
175–185
Even though both teams have scored 150 after 15 overs, their projected totals are completely different because of the number of wickets remaining.
3. Match Format
Different cricket formats naturally produce different scoring patterns.
| Format | Typical Competitive Score |
|---|---|
| T20 | 170–210 |
| ODI | 280–340 |
| Test | Depends on innings and match situation |
The calculator automatically adjusts its projection according to the selected format.
4. Pitch Conditions
Not every cricket pitch behaves the same way.
A batting-friendly surface generally results in higher projected totals because:
- The ball comes nicely onto the bat.
- Boundaries are easier to score.
- Batters can play attacking shots with confidence.
On the other hand, bowling-friendly or slow pitches usually reduce scoring rates due to uneven bounce, turn, or seam movement.
When using the calculator, selecting the correct pitch type helps generate a projection that better reflects actual match conditions.
5. Dew Factor
Dew is one of the most overlooked factors in cricket score prediction.
During evening matches, moisture on the outfield and ball can make bowling more difficult. Spinners often struggle to grip the ball, while pacers find it harder to execute slower deliveries and yorkers consistently.
As a result, batting generally becomes easier in the later stages of the game.
By including a dew option, the calculator adjusts the projected score to account for this advantage, making predictions more realistic for day-night matches.
Ground Size and Boundary Dimensions
One of the biggest reasons projected scores vary from one stadium to another is ground size. Two teams may score at the same run rate after 10 overs, but the final totals can be very different depending on the size of the boundaries.
Smaller grounds generally lead to:
- More sixes
- Higher strike rates
- Easier boundary hitting
- Higher projected scores
Larger grounds often produce:
- More singles and doubles
- Fewer maximums
- Greater importance of running between the wickets
- Lower projected totals
That’s why our Projected Score Calculator includes a Ground Size option when you use the manual prediction mode. By selecting the appropriate ground size, the calculator adjusts the expected scoring rate to provide a more realistic prediction.
Typical Impact of Ground Size
| Ground Size | Expected Impact |
|---|---|
| Small | Higher scoring, more sixes, projection increases |
| Medium | Balanced scoring conditions |
| Large | Lower scoring, projection slightly decreases |
For example, a projected score of 185 on a small venue might translate to only 172–175 on a much larger ground where clearing the ropes is considerably more difficult.
Understanding Different Phases of an Innings
A cricket innings rarely progresses at a constant scoring rate. Teams typically accelerate and slow down depending on the stage of the innings.
Professional analysts therefore divide an innings into different phases when estimating projected scores.
Powerplay Overs (Overs 1–6 in T20)
The Powerplay is generally the fastest scoring period of a T20 innings because fielding restrictions allow only two fielders outside the 30-yard circle.
Batters usually look to:
- Attack the new ball
- Maximize boundaries
- Build momentum
- Put pressure on fast bowlers
A team scoring 65/1 after six overs is often projected to finish between 190 and 215, depending on wickets remaining and batting depth.
However, if the team loses early wickets, the projection may be revised downward because the middle order often needs time to rebuild.
Middle Overs (Overs 7–15)
The middle overs are often the most tactical period of the innings.
Fielding restrictions are relaxed, and bowlers attempt to slow the scoring rate using spin, cutters, and variations.
Teams generally focus on:
- Rotating strike
- Preserving wickets
- Targeting weaker bowlers
- Preparing for the death overs
A batting side that reaches 120/3 after 15 overs has a strong platform for an explosive finish.
If the same team is 120/7 after 15 overs, the projected score could be 20–30 runs lower because fewer recognized batters remain.
Death Overs (Overs 16–20)
The final overs usually produce the highest scoring rates of the innings.
Batters often attempt to hit every ball to the boundary, while bowlers rely on yorkers, slower balls, and wide lines to restrict scoring.
If a team has plenty of wickets in hand, its scoring rate during the death overs may increase dramatically.
For example:
After 15 Overs
Score:
145/2
Current Run Rate:
9.67
A simple mathematical projection suggests:
193 runs
However, because the team has eight wickets remaining and aggressive finishers yet to bat, a realistic projected score might be closer to 205–215.
This is why advanced projection models often predict higher totals than basic run-rate calculations.
First Innings Projection vs Chase Projection
Predicting the first innings differs significantly from estimating the outcome of a run chase.
First Innings Projection
During the first innings, the calculator estimates the final score by analyzing:
- Current score
- Overs completed
- Wickets remaining
- Pitch conditions
- Match format
- Ground size
- Dew factor
The output is a projected total such as:
India: 198/6
Second Innings Chase Prediction
When chasing a target, additional variables come into play.
Instead of estimating only the batting side’s final score, the calculator evaluates whether the chasing team is likely to reach the target before running out of overs.
It considers:
- Target score
- Runs required
- Current score
- Required run rate
- Current run rate
- Wickets remaining
- Overs remaining
- Pitch conditions
- Dew advantage
For example:
Target:
201
Current Score:
92/2 after 10 overs
Current Run Rate:
9.2
Required Run Rate:
10.9
The calculator may predict:
203/5 in 19.4 overs
This provides a much more useful forecast than simply projecting the batting team’s final total.
Why Does the Projected Score Change After Every Ball?
Many viewers notice that the projected score displayed on television changes almost every delivery.
This happens because every ball affects one or more of the variables used in the calculation.
For example:
A Boundary
A four immediately increases the current run rate, causing the projected score to rise.
A Dot Ball
A dot ball reduces the current scoring rate slightly, lowering the projected total.
A Wicket
Losing a wicket often has a much greater impact than a single dot ball because:
- A new batter needs time to settle.
- Aggressive hitters may already be dismissed.
- The batting side may become more cautious.
As a result, projected scores frequently decrease after wickets.
Consecutive Sixes
If a batter hits several boundaries in quick succession, the expected run rate increases dramatically.
The projection is therefore revised upward.
Example: How a Projection Changes During an Innings
Imagine a T20 innings progressing as follows:
| Overs | Score | Projected Total |
|---|---|---|
| 5 | 46/0 | 184 |
| 8 | 70/1 | 176 |
| 10 | 95/2 | 190 |
| 13 | 126/3 | 194 |
| 16 | 158/3 | 208 |
| 18 | 183/4 | 215 |
| 20 | 212/5 | Final Score |
Notice how the projected score is continuously updated based on the evolving match situation.
Real Match Example (T20)
Suppose a team reaches:
84/1 after 9 overs
Current Run Rate:
9.33
A basic projection gives:
187
However, the calculator also considers:
- Nine wickets effectively available (only one wicket lost)
- Batting-friendly surface
- Heavy dew expected later
- Small boundaries
These conditions increase scoring potential.
The adjusted projected score may therefore be:
198–205
This better reflects how modern T20 cricket is played.
Real Match Example (ODI)
Current Score:
165/2 after 30 overs
Current Run Rate:
5.50
Simple Projection:
275
However:
- Eight wickets remain.
- Batting Powerplay is still available.
- Set batters are well established.
- Death overs generally score faster.
The revised projection could be:
305–320
Professional analysts frequently make similar adjustments during international matches.
Common Mistakes While Calculating Projected Scores
Many fans calculate projected scores incorrectly because they overlook important match variables.
Some of the most common mistakes include:
Assuming the Run Rate Never Changes
Teams rarely score at the same pace throughout an innings. Most accelerate significantly during the final overs.
Ignoring Wickets
A team at 150/2 has a very different scoring potential from a team at 150/8, even though both have the same number of runs.
Forgetting Pitch Conditions
A slow, turning surface can reduce scoring opportunities, while a flat batting track encourages aggressive stroke play.
Not Considering Ground Dimensions
Large grounds reduce boundary frequency and generally lower projected totals.
Ignoring Dew
Evening dew can make batting easier and bowling more difficult, especially in day-night matches.
Using Only Basic Mathematics
Many online calculators simply multiply the current run rate by the total number of overs.
While quick, this method ignores the tactical nature of cricket and often produces unrealistic estimates.
Our Projected Score Calculator goes beyond this by incorporating multiple match variables to generate a more practical prediction.
Tips to Improve Score Predictions
If you regularly estimate cricket scores—whether for fantasy contests, match analysis, or simply following the game—these tips can improve your accuracy:
- Pay close attention to wickets in hand rather than runs alone.
- Consider whether aggressive finishers are still available to bat.
- Factor in pitch behaviour and weather conditions.
- Watch for dew during evening games.
- Account for boundary dimensions and venue characteristics.
- Compare the current run rate with the required run rate during chases.
- Reassess the projection after every over, as match dynamics can change rapidly.
Projected Score in Different Cricket Formats
Every format of cricket has its own scoring pattern, batting strategy, and match dynamics. A projected score that is considered match-winning in one format might be below average in another.
Understanding these differences helps you interpret projected scores more accurately and make better predictions while watching live matches.
Projected Score in T20 Cricket
T20 cricket is the fastest format of the game, where every ball matters. Teams generally aim to maximize scoring opportunities from the very first over.
A competitive projected score in T20 depends on several factors:
- Venue
- Pitch conditions
- Ground dimensions
- Bowling attack
- Weather conditions
Typical T20 Projected Scores
| Projected Score | Match Situation |
|---|---|
| Below 140 | Below Average |
| 140–160 | Competitive on bowling-friendly pitches |
| 160–180 | Good Total |
| 180–200 | Very Strong Total |
| 200–220 | Excellent Score |
| 220+ | Exceptional Batting Performance |
Modern franchise leagues like the IPL frequently witness projected totals exceeding 200 due to aggressive batting strategies and impact players.
Projected Score in One Day Internationals (ODIs)
ODIs provide batters with more time to build an innings before accelerating during the final overs.
Unlike T20 cricket, teams usually pace their innings across three distinct phases:
- Opening Powerplay
- Middle Overs
- Death Overs
Typical ODI Projected Scores
| Projected Score | Match Outlook |
|---|---|
| Below 240 | Below Par |
| 240–270 | Competitive |
| 270–300 | Strong Total |
| 300–330 | Excellent Score |
| 330–360 | Dominant Performance |
| 360+ | Rare and Outstanding |
When a team reaches 180/2 after 30 overs, analysts often project a final score of 320 or more, assuming wickets remain in hand.
Projected Score in Test Cricket
Although Test cricket does not have an over limit, projected scores remain valuable for:
- Predicting first innings totals
- Declaring at the right time
- Estimating match progression
- Planning bowling workloads
Rather than predicting a fixed score after 20 or 50 overs, analysts estimate:
- Total runs before declaration
- Runs per session
- Runs per day
- Partnership potential
For example:
Current Score
280/4
Day 2 Lunch
Projected First Innings Total
430–470
These projections help teams decide whether to accelerate or continue batting patiently.
Projected Scores in Franchise Cricket
Franchise tournaments like the IPL have significantly changed batting approaches.
Teams now:
- Attack from the first over.
- Use specialist finishers.
- Rotate match-ups strategically.
- Target weaker bowlers.
As a result, projected scores have steadily increased over the last decade.
Many venues now regularly produce first-innings projections above 200 runs, particularly on flat batting pitches.
What Is Considered a Good Projected Score?
There is no universal answer because every match is played under different conditions.
However, the following table provides a useful guideline.
| Format | Average Winning First Innings Score |
|---|---|
| T20 | 170–190 |
| ODI | 280–320 |
| Test | Situation Dependent |
Several factors can significantly alter what constitutes a defendable score:
- Pitch behaviour
- Dew
- Toss result
- Boundary dimensions
- Bowling quality
- Opposition strength
A projected total of 165 may be match-winning on a slow, turning pitch but below average on a batting paradise.
Projected Score vs Current Run Rate
These two terms are often confused.
Although related, they represent different statistics.
| Current Run Rate | Projected Score |
|---|---|
| Current scoring speed | Estimated final total |
| Changes every over | Changes after every ball |
| Based on runs already scored | Based on future scoring potential |
| Doesn’t predict the future | Predicts expected outcome |
Example
Current Score
110/2 after 11 overs
Current Run Rate
10.00
Projected Score
200
The run rate simply tells you how quickly the team has scored so far.
The projected score estimates where the innings is likely to finish.
Projected Score vs Required Run Rate
Required Run Rate only applies during the second innings.
| Projected Score | Required Run Rate |
|---|---|
| Predicts batting team’s final score | Indicates runs needed per over to win |
| Used in both innings | Used only while chasing |
| Based on current performance | Based on target remaining |
Example
Target
201
Current Score
95/2 after 10 overs
Current Run Rate
9.5
Required Run Rate
10.6
Projected Score
198
In this situation, the chasing team is scoring well but is still projected to finish slightly short of the target.

Projected Score vs Net Run Rate
Many new cricket fans confuse projected score with Net Run Rate (NRR).
These statistics serve entirely different purposes.
| Projected Score | Net Run Rate |
|---|---|
| Used during a live innings | Tournament statistic |
| Predicts current match outcome | Measures season performance |
| Updated every ball | Updated after completed matches |
| Helps estimate total score | Helps determine league standings |
How Television Broadcasters Calculate Projected Scores
If you’ve watched international cricket or the IPL, you’ve probably noticed projected scores displayed on television throughout an innings.
Broadcasters use advanced statistical models rather than simple multiplication.
These systems typically analyse:
- Current run rate
- Historical scoring patterns
- Venue averages
- Batting partnerships
- Wickets remaining
- Batter strike rates
- Bowler economy rates
- Match phase
- Pitch reports
- Historical venue scoring trends
Modern broadcast graphics are powered by real-time data feeds and predictive algorithms that continuously update after every delivery.
Although different broadcasters use different models, the objective remains the same: provide viewers with the most realistic estimate of the final score.
How Fantasy Cricket Players Use Projected Scores
Projected scores have become an important tool for fantasy cricket enthusiasts.
By understanding how an innings is likely to progress, fantasy managers can anticipate where points are likely to come from.
Projected scores help identify:
Batters Likely to Accelerate
If a team is projected to finish above 200, middle-order power hitters may receive more opportunities to score quickly.
Death Bowlers
A high projected score often means specialist death bowlers will bowl under pressure, creating opportunities for wickets as batters attack aggressively.
Captain and Vice-Captain Decisions
Before the second innings begins, projected first-innings totals provide clues about how aggressively the chasing team may need to bat.
Match Flow
Fantasy contests often reward players who understand momentum rather than simply following scorecards.
Projected scores provide valuable insight into likely match progression.
How Coaches and Analysts Use Projected Scores
Professional teams rely heavily on projections throughout a match.
Analysts continuously evaluate whether the batting side is:
- Ahead of expectations
- Matching expectations
- Falling behind expectations
These insights influence tactical decisions such as:
- Promoting aggressive batters
- Delaying finishers
- Targeting particular bowlers
- Conserving wickets
- Timing the acceleration phase
Projected scores are therefore an integral part of modern cricket strategy rather than just an interesting statistic for fans.
Historical Trends in Cricket Scoring
Cricket scoring has evolved dramatically over the years.
Early T20 Era
A projected score of 160 was often considered match-winning.
Modern Franchise Cricket
Today, teams regularly aim for 190–210, with totals above 220 becoming increasingly common on batting-friendly surfaces.
Similarly, ODI cricket has seen average first-innings totals increase as batting strategies have become more aggressive and fielding restrictions have encouraged attacking play.
These historical trends highlight why projected score calculators must adapt to modern scoring patterns rather than relying on outdated averages.
Venue Matters More Than Many Fans Realize
The same batting performance can lead to very different projected totals depending on the venue.
For example:
Batting-Friendly Stadiums
Characteristics include:
- Flat pitches
- Short boundaries
- True bounce
- Fast outfields
These venues generally produce higher projected scores.
Bowling-Friendly Stadiums
Characteristics include:
- Green surfaces
- Swing-friendly conditions
- Variable bounce
- Large boundaries
Projected scores are often lower because scoring opportunities are reduced.
This is why our calculator allows users to account for pitch conditions and ground size when making manual predictions.
Can a Low Projected Score Still Win a Match?
Absolutely.
Cricket is highly dependent on conditions.
For example:
- A projected total of 145 may be below average on a flat batting pitch.
- The same projected total could be match-winning on a slow, turning wicket where chasing becomes extremely difficult.
Instead of focusing solely on the projected number, always compare it with:
- Average first-innings scores at the venue
- Pitch behaviour
- Weather conditions
- Opposition batting strength
- Bowling resources available
A score should always be evaluated in context rather than in isolation.
Frequently Asked Questions (FAQ)
How is the projected score calculated?
The calculator’s formula for calculating runs is: Current Score + (Expected Runs in Remaining Overs) Ratio of runs, wickets lost, and pitch condition.
Which match formats does this apply to?
While this calculator is designed for limited-overs cricket (T20, ODI and club matches), it can be used to guide any format of playing.
Does pitch condition affect the projected score?
By using multipliers for batting-friendly, bowling- friendly, and slow/low pitches, the calculator provides more precise estimates.
Can I use this for both live matches and simulations?
Absolutely. It’s ideal for real-time match tracking or exploring “what if” cricket scenarios
Why does the projected score change after every ball?
Every ball can affect:
Current run rate
Wickets remaining
Required run rate (during chases)
Momentum
A boundary usually increases the projected total, while dot balls and wickets often reduce it. This is why television broadcasts continuously update the projected score throughout an innings.
What is considered a good projected score in T20 cricket?
While conditions vary, these are useful benchmarks:
Projected Score
Assessment
Below 140
Difficult to defend on most pitches
140–160
Competitive in bowling-friendly conditions
160–180
Good total
180–200
Strong total
200+
Excellent batting performance
Always compare the projection with the venue’s average first-innings score.
What is a good projected score in an ODI?
Generally:
240–270: Competitive
270–300: Strong
300–330: Excellent
330+: Dominant batting display
Venue conditions and opposition quality can significantly influence these benchmarks.
Can wickets affect the projected score?
Absolutely.
For example:
140/2 after 15 overs suggests plenty of batting resources remain, leading to a higher projection.
140/8 after 15 overs often results in a much lower projected score because the batting side is close to being bowled out.
Wickets remaining are one of the most important variables in score prediction.
Why does dew increase projected scores?
Dew makes the ball slippery, making it harder for bowlers—especially spinners—to grip and control.
This often leads to:
Easier stroke play
More boundaries
Higher scoring rates
That’s why our calculator includes a dew factor when generating projections.
Can this calculator predict the winner?
The calculator primarily predicts:
First-innings totals
Second-innings chase outcomes
While a strong projected score can indicate which team has the advantage, cricket matches are influenced by many variables, and no calculator can guarantee the final result.
Is this calculator suitable for IPL matches?
Yes.
It works well for:
IPL
T20 Internationals
ODI matches
Domestic T20 leagues
Franchise cricket
Local tournaments
Simply select the appropriate match format and conditions for the most accurate estimate.
Does the calculator work for live matches?
Yes.
The Live Match mode automatically reads current match information and predicts:
First-innings totals
Chase outcomes
Winning margins (where applicable)
You can also use the Manual Entry mode if your match isn’t listed.
Why Choose Cricket Stance’s Projected Score Calculator?
Unlike many online calculators that rely solely on the current run rate, Cricket Stance’s Projected Score Calculator incorporates multiple match variables to deliver more realistic predictions.
Key Features
Live Match Prediction
Manual Score Prediction
T20 and ODI Support
First Innings Projection
Second Innings Chase Prediction
Pitch Adjustment
Dew Adjustment
Ground Size Consideration
Wicket-Based Prediction
User-Friendly Interface
Mobile-Friendly Design
Instant Results
Completely Free to Use
Whether you’re following a high-pressure IPL chase or analysing a domestic tournament, the calculator provides quick, data-driven insights to enhance your understanding of the game.
Expert Tips for Better Projected Score Predictions
To get the most from any projected score:
- Compare the projection with the venue’s historical average.
- Pay attention to wickets in hand rather than just the current score.
- Recalculate after every over, especially during the death overs.
- Consider weather and dew in day-night matches.
- Evaluate batting depth before assuming a team will accelerate.
- Watch for partnerships, as long stands often lead to higher final totals.
- Remember that projections are estimates, not guarantees.
Using these tips alongside the calculator will help you interpret match situations more effectively.
Common Myths About Projected Scores
Myth 1: Projected score equals the final score.
Reality: It is an estimate that changes throughout the innings.
Myth 2: Current run rate alone determines the projected score.
Reality: Wickets, pitch, dew, and match phase all influence the prediction.
Myth 3: Every 180-run projection is equally strong.
Reality: A projected score of 180 on a slow pitch may be excellent, while the same score on a flat batting surface might only be average.
Myth 4: Projected scores are only useful for commentators.
Reality: Fantasy players, coaches, analysts, and everyday cricket fans all use projected scores to better understand match situations.
Reference
- Cricket Score Predictor: Predict Scores In Real Time
- Cricket Calculator | Strike Rate | Economy Rate | Run Rate
Final Thoughts
Cricket has evolved into a game driven by data, strategy, and real-time analysis. Understanding the projected score allows you to see beyond the current scoreboard and anticipate how an innings is likely to unfold.
Whether you’re watching an IPL thriller, following an ODI World Cup match, analysing a domestic tournament, or competing in fantasy cricket, projected scores offer valuable insights into momentum, scoring potential, and match strategy.
Our Projected Score Calculator combines current run rate, wickets in hand, match format, pitch conditions, dew factor, and ground size to generate realistic predictions in just a few seconds. Instead of relying on rough mental calculations, you can use an advanced projection model designed specifically for modern cricket.
Try the calculator above, experiment with different match situations, and see how changing wickets, overs, or conditions can dramatically alter the expected final score. It’s free, fast, mobile-friendly, and built for cricket fans who want smarter match analysis.
Disclaimer
This Projected Score Calculator uses mathematical models and cricket heuristics to estimate potential scores based on match data. Actual game outcomes may differ due to unpredictable events, player performance, and changing pitching or weather conditions. Use this tool for entertainment and analysis purposes; do not rely on it for betting or official match decisions.
Cricket Stance provides fantasy cricket tips for entertainment purposes only. Participation in paid contests is for users 18+ and subject to local laws.


